
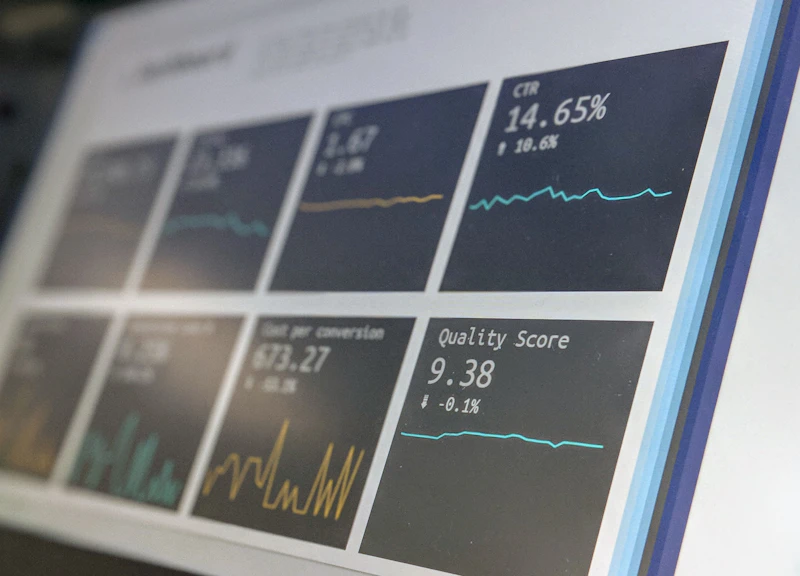
Medical colleges face a grading problem most other faculties don’t. When hundreds of students sit a high-stakes anatomy or pharmacology exam, the score distribution tells you something about the paper, the cohort, and the teaching — but only if you can read it quickly. A bell curve generator for medical colleges turns raw score lists into a visual distribution that exam boards can actually act on, without waiting for a spreadsheet specialist to produce charts.
If your institution still exports marks into a legacy system and manually builds charts for moderation meetings, this guide walks through what a good bell curve workflow looks like, where it fits in medical education, and how to evaluate the tools available.
The Real Issue: Medical Exams Produce Messy Distributions
Medical programs are notorious for bimodal score patterns. A cohort might have a cluster of high performers and a second cluster of students who struggled, producing a distribution that looks nothing like a clean bell. That pattern is not a failure of the tool — it is a signal. It can indicate that the exam had ambiguous questions, that a teaching block was missed, or that the cohort contains two genuinely different preparation levels.
The problem is that most grading workflows hide these signals. A registrar or academic coordinator receives a CSV of scores, calculates an average, and moves on. The average hides the bimodality. The standard deviation hides the outliers. Only a visual distribution reveals what is actually happening.
A bell curve generator for medical colleges addresses this by computing mean, standard deviation, skewness, and kurtosis automatically, and by flagging when a cohort looks skewed or multimodal. That flagging matters more than the chart itself — it tells the exam board where to look before the meeting starts.
Why Score Distribution Review Matters in Medical Education
Medical colleges operate under accreditation pressure. External reviewers, professional bodies, and university quality assurance teams expect evidence that assessments are fair, calibrated, and consistent across cohorts. A bell curve chart is one of the simplest forms of that evidence.
When a medical school can show that a final-year OSCE-adjacent written paper produced a normal distribution with reasonable spread, it demonstrates that the exam discriminated between levels of student ability. When the distribution is tightly clustered — a mean of 72% with a standard deviation of 4 — it suggests the paper was too easy or the cohort was unusually homogeneous, and the exam may need moderation before results are approved.
The standard deviation is the number to watch. A mean of 65% with σ = 5 means students performed similarly and the exam discriminated poorly. A mean of 65% with σ = 18 means substantial variation in preparation or ability — and likely warrants a review of teaching coverage or assessment design. Medical colleges should look at both numbers together, never the mean alone.
What Good Looks Like in a Medical College Workflow
A mature score-analysis workflow for a medical college has four stages:
- Import — Paste scores or upload a CSV with student IDs and marks. The system should handle absent students, N/A entries, and extra credit without breaking.
- Analyze — Generate the bell curve, review the distribution shape, and check the normality indicators. Skewness near zero and excess kurtosis near zero suggest a well-calibrated paper.
- Compare — Overlay multiple cohorts or multiple sittings on one chart. If two campuses sat the same exam, their distributions should look similar. If they do not, that is a moderation question.
- Report — Export a PDF with the chart, key statistics, and grade distribution for the exam board file. The report should be clean enough to attach to minutes.
The bell curve generator from UniCloud360 supports all four stages. It runs entirely in the browser, so no student data leaves the institution. It computes sample mean and standard deviation using Bessel’s correction — consistent with Excel’s STDEV — and it flags small cohorts, skewed distributions, and likely multimodal patterns before you present the chart to a committee.
Common Mistakes Medical Colleges Make
Mistake one: forcing a bell shape. A bell curve generator does not force grades onto a curve. It visualizes what actually happened. If your institution wants to apply a curving model — absolute curve, σ-based, or flat — the tool should offer that as an explicit option, not as a hidden default.
Mistake two: ignoring the cohort size. A class of 30 students will rarely produce a clean normal distribution. The tool should warn you when the cohort is too small for normality assumptions. Medical colleges often run small elective modules alongside large core cohorts — both need different interpretation.
Mistake three: treating tied scores at boundaries inconsistently. When a grade bracket boundary falls exactly on a score, the policy must be consistent. The UniCloud360 tool promotes tied scores at bracket boundaries into the higher bracket, which is a defensible default — but your exam board should state that policy explicitly in its procedures.
Mistake four: only looking at one cohort. Medical programs often run the same exam across multiple campuses or multiple sittings. Comparing distributions side by side reveals moderation issues that a single chart hides. The tool’s multi-cohort comparison and historical trend views exist precisely for this.
How to Evaluate a Bell Curve Tool for Your Medical College
When you evaluate options, ask these questions:
- Does it handle absent and ungraded students correctly? Medical cohorts have legitimate absences. The tool should let you treat them as 0 or exclude them, with clear data flags.
- Does it compute the statistics your exam board actually cites? Mean, median, standard deviation, skewness, and kurtosis should all appear in the summary — not buried in a separate export.
- Does it support curving models transparently? If your college curves grades, the tool must show the formula (e.g., A ≥ μ+0.5σ, B ≥ μ) and warn when the cohort is too small or skewed for that model to be valid.
- Does it produce a report you can file? A summary report with chart, key stats, grade distribution, and sign-off is the minimum. A full report with advanced statistics and the complete student outcomes table is better for accreditation files.
- Does it respect data privacy? Computation in the browser, with no data sent anywhere, is the strongest guarantee for student score data.
Where UniCloud360 Fits
The bell curve generator is a free standalone tool, but it is part of a broader platform. When your medical college is ready to move beyond one-off chart generation, the Lecturer Portal generates score distributions automatically from live assessment data — no CSV exports, no manual chart building. That connects to Exam Management, which handles the workflow around the analysis.
For institutions thinking about the bigger picture, the UniCloud platform and Cloud-Based Student Management System show how score analysis fits into wider higher-education decision-making, including the Student 360 System view that connects assessment outcomes to attendance and support needs.
Frequently Asked Questions
Can a bell curve generator force grades onto a normal distribution? No. The tool visualizes the actual distribution and offers optional curving models — absolute, σ-based, flat, or custom — that you can apply deliberately. It never silently reshapes grades.
What does a bimodal distribution mean for a medical exam? It suggests two distinct performance clusters in the cohort. This could indicate ambiguous questions, uneven teaching coverage, or genuinely different preparation levels. It warrants investigation before results are approved.
How small can a cohort be before the bell curve is unreliable? The tool warns when the cohort is too small for normality assumptions. As a rule of thumb, distributions from cohorts under roughly 30 students should be interpreted cautiously, and the warning should appear in the report.
Does the tool work with student IDs and names? Yes. It accepts one score per line or StudentID, Score per line, and any ID format works — student number, name, or code. Absent, N/A, or blank entries are handled explicitly.
Final Thought
A bell curve generator for medical colleges is not about making charts look pretty. It is about giving exam boards a defensible, evidence-based view of how a cohort performed before grades are approved. If your medical college still relies on manual spreadsheet analysis for moderation, start with the free bell curve generator on your next exam cycle. Then look at how a connected platform can automate the workflow entirely.
Talk to UniCloud360 about your institution’s workflow to see how score analysis fits into your broader academic operations.


